Please contact the platform here (connectomicsplatform.sbri@inserm.fr) for all request regarding your project and do not forget to provide a short description of your scientific aim. We will contact you to propose evaluation of feasibility, guidance and expertise for your specific project.
A connectome is a comprehensive map of the connections of a specified component of the nervous system. The Connectomics Platform is more specifically concerned with the investigation of the cortical and subcortical connectome at the meso-scale. That is to say the comprehensive set of connections linking cortical and subcortical structures with a special focus on two model organisms, the macaque and the mouse. The fact that the connectome deals with comprehensive atlases, means that there is a need to develop high-throughput analysis of connectivity. The platform is geared to analyzing cortical and subcortical inputs to defined cortical areas that are determined using high-fidelity, high-sensitivity retrograde tracers.
The connectome can be viewed as a graph and its analysis exploits definitions and algorithms used in graph theory. The density of the cortical graph is very high (macaque 67%, mouse 97%) and the range of weights of connections span 5 to 6 orders of magnitude, meaning that binary, connected/not-connected measurements are of little value. The determination of the weighted cortical graph requires accurate counts of labeled neurons in order to generate reliable and consistent connectivity profiles of individual areas. We are currently extending our databased by integrating subcortical inputs to cortical areas.
Through the Connectomics Platform, we provide expertise and help to projects that would potentially contribute to our goal of describing the statistical properties of the complete NHP connectome (contact here connectomicsplatform.sbri@inserm.fr for any request regarding your project with a short description of your scientific aim).
The Connectomics Platform consists of three interrelated facilities: (i) a customized surgical suite for injection of tracers; (ii) a histology lab for preparing material for microscopic examination; (iii) microscope facilities including automated Slice Scanner (Zeiss Axioscan); (iv) an analysis pipeline for MRI-based surface mapping and automated counts of labeled cells.
Mouse and macaque databases that have been constructed by this platform can be obtained here : http://www.core-nets.org.
Surgical suite
Fully equipped for investigating the anesthetized macaque in a stereotaxic apparatus (respirator, CO2 monitor, blood pressure and CO2 monitor, heating blanket). Tracer injections are made using BrainSight® technology from Rogue Research Inc, a brain navigator tool that exploits high-resolution CT scan and MRI scans acquired in the 3-T Siemens MRI scanner in Primage (imaging platform annexed to SBRI) and a 24-channels head coil for high-resolution MRI data according to HCP_NHP protocols.
Histology lab
Tissue is prepared in a fully equipped histology lab with chemicals and glassware. The histology lab has linear hooded mounting desks for mounting sections, freezers and refrigerators for storing sections, antibodies, and appropriate reagents for immunohistochemistry, and equipment for various types of stains. The histology lab is equipped with a large microtome for cutting NHP brains. The Microm HM 440 E Microtome is an ergonomically-designed sliding microtome. It employs electronic control systems and high-precision mechanics to achieve optimal section quality and reproducibility of paraffin and frozen specimens. It can accommodate specimen sizes up to 80 x 60 mm, and can cut sections ranging from 1 to 100 microns.
Microscope facilities
Our automated imagery station exploits slide scanning technology (up to 100 slides magazine). Zeiss Axioscan 7 uses multiple channels to create virtual digital copies of sections with up to 5 different tracers that are detected at distinct wave-lengths and subsequently analyzed using our dedicated analysis pipeline for 2D-to-3D surface mapping of label, automated area segmentation and precise quantification of labeled cells.
The platform also disposes of 4 fluorescent microscopy stations running on the Mercator program and exploiting ExploraNova® software for neuronal cartography in order to explore projection pathways. Analysis consists in the recording of the XY coordinates of very large numbers of neurons using a digitalized imaging system equipped with automatic cell counting. 2D cartography of neuronal labeling is used to reconstruct 3D (Map3D) maps to obtain accurate data on individual neuron pathways length, important for modeling networks of the cerebral cortex. One of the stations exploits the Morphostrider® software from ExploraNova®, which allows automatic 2D reconstructions of large and high-defined images with multiple wave-lengths.
1 / Slice Scanner Zeiss Axioscan 7 equipped with solid-state light source Colibri 7
Objectives : x5 x10 x20; Filter : 110 HE LED technical specs; Camera Set Hamamatsu Orca Flash 4.0 V3; ZEN expert software.
2 / Microscope Leica Dialux 22 with fluorescence
Objectives : x2,5 x10 x25 x50 x100; Filter : D; Camera Sony DXC950-P; Mercator expert software.
3 / Microscope Leica DMRE with fluorescence
Objectives : x1,6 x5 x10 x20 x25 x40; Camera Jenoptik ProgRes CF; Filters : XF102-2, N2-1, XF100-2, D, XF13-2, XF103; Mercator expert software.
4 / Microscope Leica DM5500 B with fluorescence.
Objectives : x2,5 x10 x20 x40; Filters : A, D, Y5, I3 and N2-1; Camera Jenoptik ProgRes CF; Mercator expert, Map3D and Morphostrider Software.
5 / Microscope Leica DM6000 with fluorescence
Objectives : x2,5 x10 x20 (dry) x20 (imm) x63 x100; Filters : TX2, D, DY, FB, I3, XF32, XF08; Camera Jenoptik ProgRes CF; Mercator expert software.
Data Generation
A semi-automated histology-to-MRI mapping pipeline has been developed to automate the data generation from the fluorescent sections to the areal connectivity profile and the surface mapped labeled neurons onto the MRI template surface. Semi-automatic plotting is done by exploiting the open software QuPath. Surface-mapping, automatic parcellation and quantification are made via in-house Python scripts. Cases plotted with the Mercator software can be also be processed by the pipeline.
For data visualization, we use connectome workbench developed by our collaborators in David Van Essen’s team at Washington University in St. Louis (USA), who also developed the enhanced HCP pipeline for NHP in collaboration with Takuya Hayashi’s team from RIKEN (Japan). Surface extraction is made using freesurfer and primarily shell scripts according to HCP-standards.
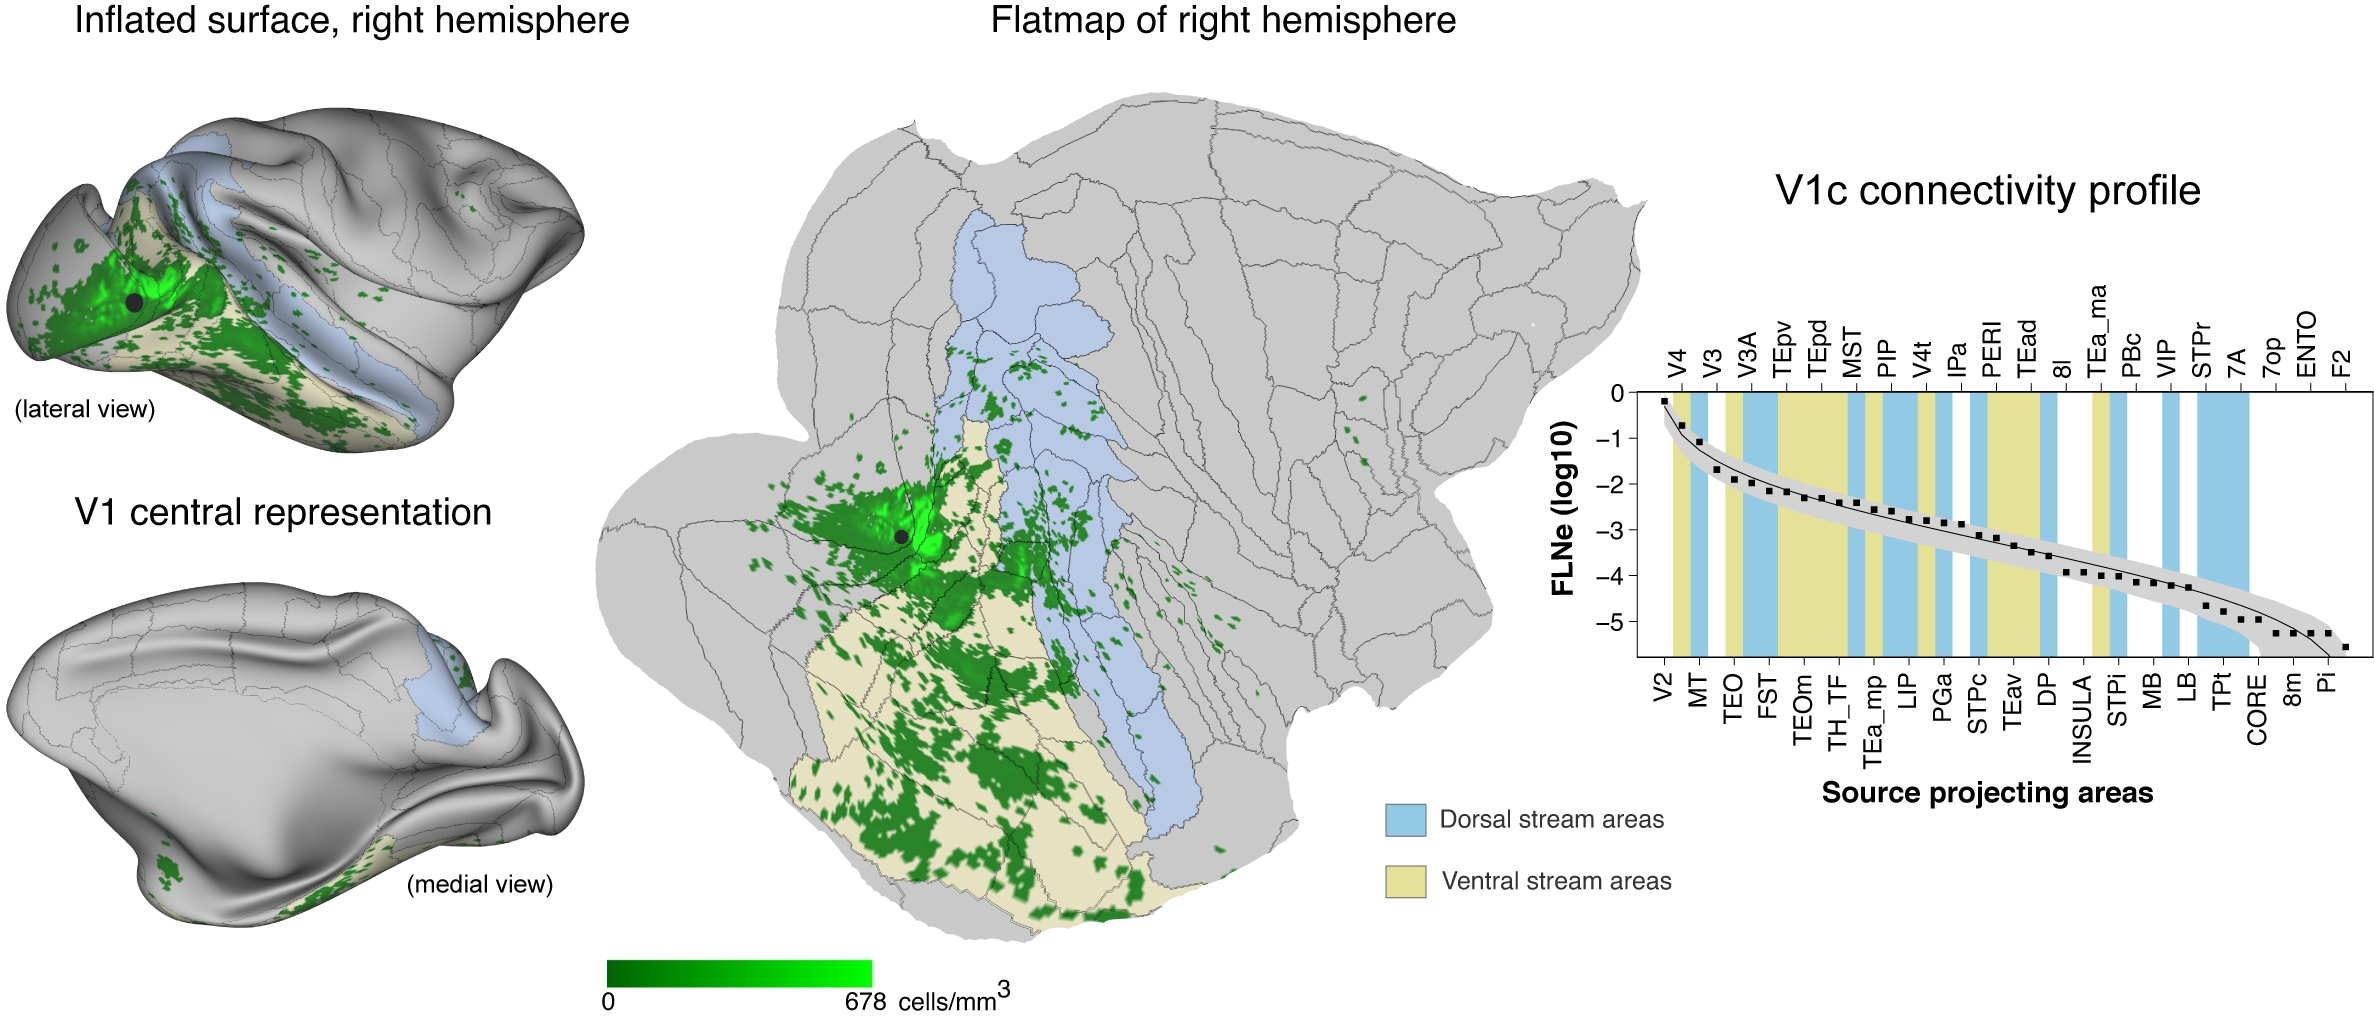
Example surface mapped labelling following retrograde tracer injection into V1c and extracted connectivity profile (right). modified from Wang, Hou et al., 2022
Data Analysis
The analysis of the structural connectivity network is done using the free software environment for statistical computing and graphics R (https://cran.r-project.org/). In particular, the majority of network properties are investigated using network analysis tools available in the R package igraph (http://igraph.org/r/). For results visualization we mainly use the packages lattice (https://cran.r-project.org/web/packages/lattice/index.html) and latticeExtra (https://cran.r-project.org/web/packages/latticeExtra/index.html). We use the package stats (https://stat.ethz.ch/R-manual/R-devel/library/stats/html/00Index.html) for additional statistical calculations.
We are currently developing an R toolbox for analyzing complex structural networks (directed, undirected, weighted and unweighted), in particular to compute commonly used measures of centrality, segregation and influence, at the local and global levels.